Electric Power Customer Outage Dashboard (Professional)
The dashboard provides up to date information on power outages throughout the country at both the national and state levels.
Outage information is collected every 15 minutes from over 950 electric utilities and covers over 94% of all customers in the country.
The interface provides multiple views of the outage data and is automatically updated as new data becomes available. The professional
version has many unique and innovative features that allow the user to customize their experience to their unique needs.
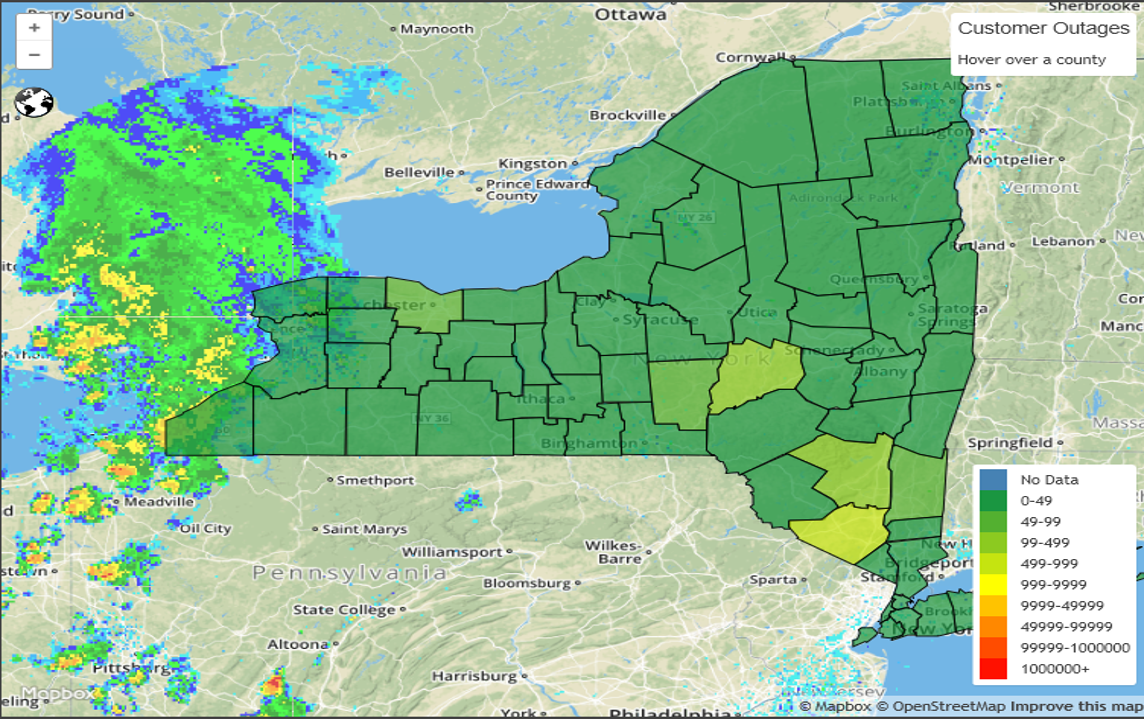
Map View
The map panel provides a geographical representation of customer outages. The overview map allows easy identification of national
“hotspots”. Clicking on a State updates the map view and associated tables, trends, and status views to reflect information
at the county level for the selected State.
Hovering over any of the features on the map shows details of the customer outages in that State or county.
|
|
|
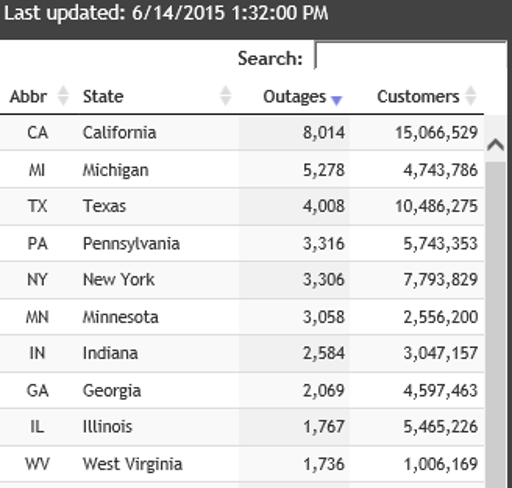
Table View
The table panel provides a tabular representation of outages consistent with the currently selected Map view. This panel also controls
navigation of to the overview map and table and also allows for the selection of multiple states.
The table can be expanded to display more states or counties rows and also additional data columns. Most columns can be sorted as well.
Additionally, the Multi-State button allows for the selection of any number of States which will be shown in all of the
views in the dashboard. The Overview button takes you back to the National view.
|
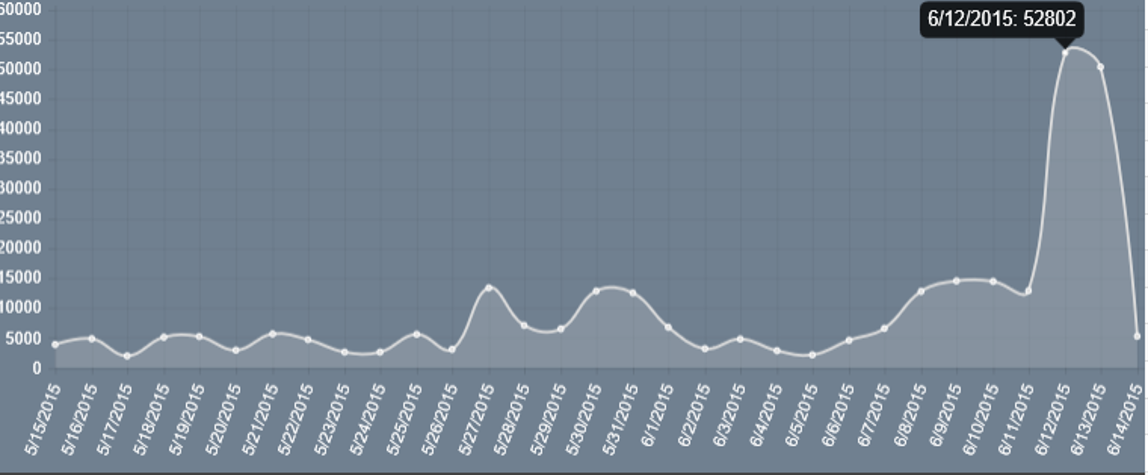
Trend View
The trend panel provides a historical representation of outages for the State(s) currently being viewed.
Up to 30 days of daily maximum outage history is displayed. The professional version also includes the
previous 36 hours of data in an hourly maximum option as well.
You can hover over any data point on the chart and it will display the date and maximum outage for that day.
|
|
|
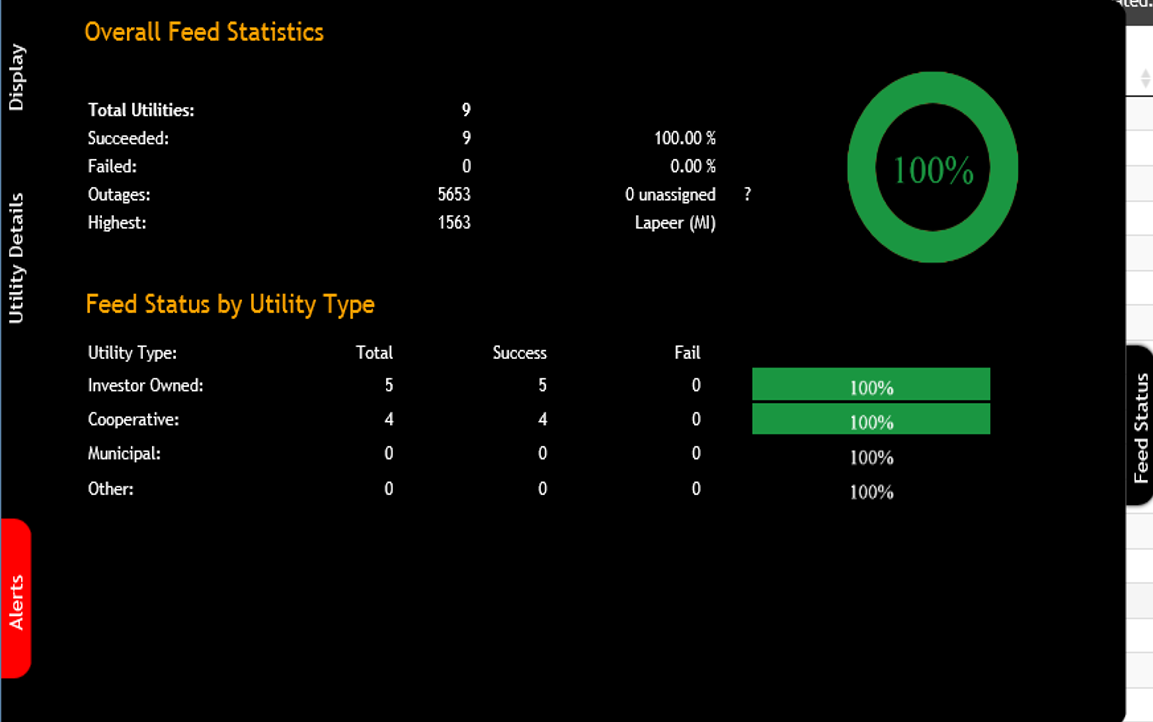
Status View
The status panel provides general statistics related to the latest data pull and includes a detailed Utility listing of feed status and outages.
It also shows the breakout by utility type (investor owned, cooperative, municipal, other) of the selected data set.
A listing of the actual utilities with associated data can be viewed by clicking the expand icon. The expanded window
shows data for each utility based on the selected view.
|
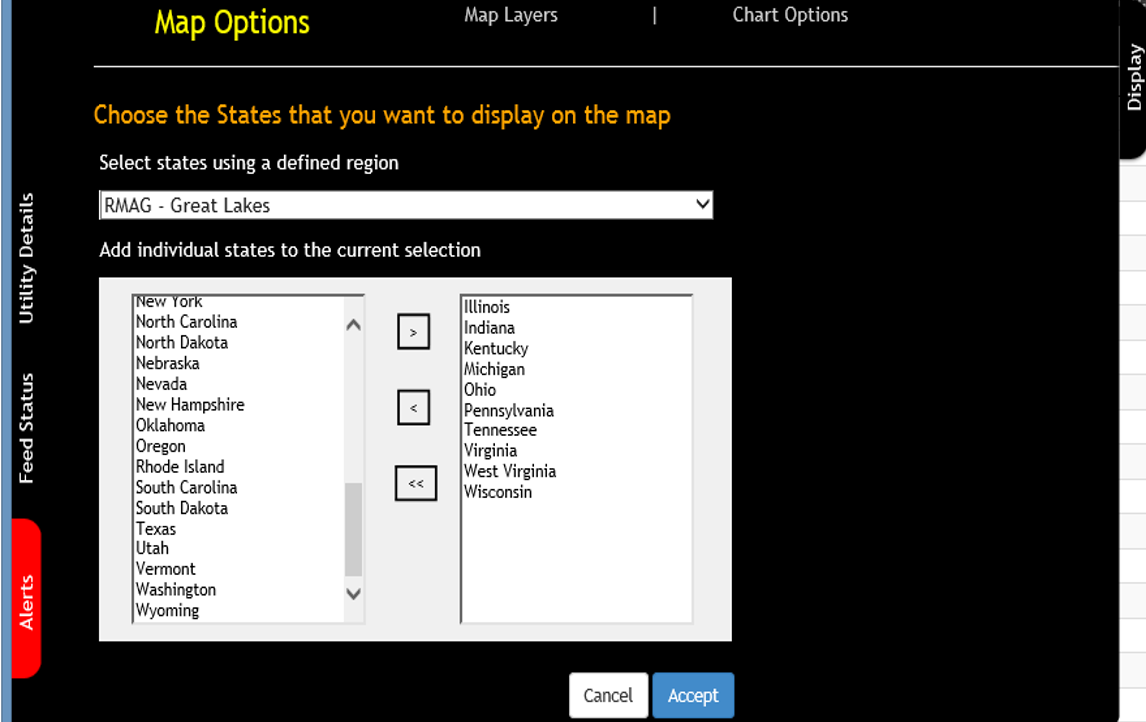
Region Selection and Layers
The ability to choose multiple States for viewing has been expanded to include selection by pre-defined regions. Anything
from FEMA regions to regional mutual assistance group can be selected and all of the displays will represent the overall
region (maps, tables, and charts). Don't see a region you need ... just let us know and we will add it.
You can now choose from a large selection of weather and hazard features to overlay on your map, from radar images to flood
warnings to hurricane paths, you can now see what is coming and how it is impact electric power delivery.
|
|
|
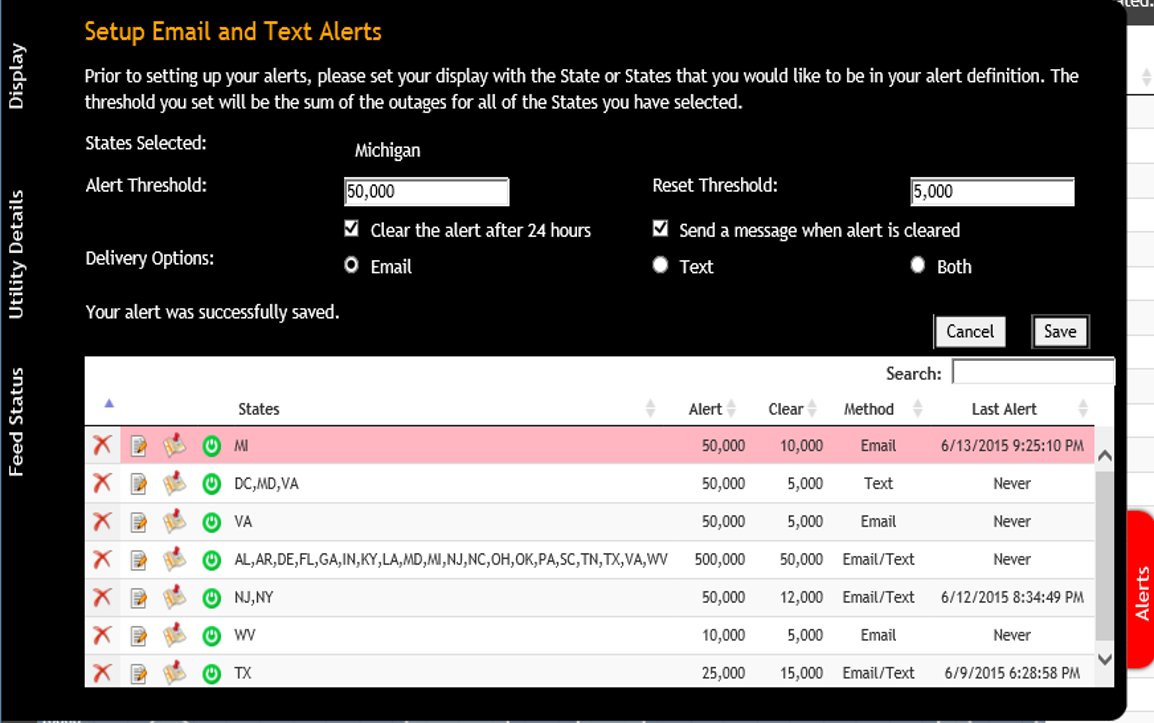
Outage Alerts
Can't look at this all day ... in all honesty neither can we. So when you can't, let it keep watch
for you. The professional version allows you to setup alert based on a specified state or set of states
as well as an alert threshold. When the sum of the outages for you selection reaches the threshold, you
tell the system to send you an email or a text message or both. You can setup multiple alerts for selection
so you can be informed when impacts escalate. The alerts are highlighted in the dashboard as well and you
can quickly change your display to any of your alert regions to see the details.
|
Purchase Options
| Tier 1 license (1 year) |
$550/user (1-2 users) |
| Tier 2 license (1 year) |
$500/user (3-6 users) |
| Tier 3 license (1 year) |
$450/user (7+ users) |
| Enterprise license (1 year) |
from $8000 |